About ARD
Maxar's Analysis-Ready Data (ARD) delivers an imagery workflow designed to minimize the work and time involved for a user to go from pixel to answer.
Built on open standards
Maxar ARD uses Cloud Optimized GeoTIFF (COG), GeoPackage, and SpatioTemporal Asset Catalog (STAC) file types to deliver data. These industry-standard formats can be read by most analysis applications and software libraries. ARD files can be plugged into any analyst’s workflow.
Cloud Native architecture
ARD orders are delivered directly to one of the following cloud storage platforms: Amazon S3, Azure Blob Storage, or Google Cloud Storage. The file formats in the ARD delivery can be read directly from the cloud or downloaded to a local directory. ARD is built around a simple concept of files organized in a directory structure.
Analysis-ready from start to finish
For data scientists, the most time-consuming part of image analysis is pre-processing the data into a readily usable format. Maxar ARD images are delivered with common pre-processing tasks already done, sorted, and organized for you. The Python SDK gives you intuitive abstractions for both getting ARD data and working on it.
Works at your technical level
The ARD team represents a wide range of technical backgrounds and ARD is used internally by Maxar analysts over a variety of technical domains. We offer ARD access methods that will please everyone:
- At its core, ARD is API driven
- Interact with ARD search and ordering in any language
- Work with lean JSON responses, or ask the API for more structured responses up to a fully functional HTML-based map viewer
- For Python developers, we offer an ARD SDK
- High level abstractions let you interact with intuitive objects, not wrappers around API responses
- The SDK includes tight integration with popular Python libraries like Rasterio and Shapely
- A beautiful web-based UI
- Need imagery and don't write code? You're not left out - the ARD Dashboard lets you search, browse, and order exactly the right images.
Tiles For Analysis
Maxar satellites are "agile" and can sweep their sensors over the earth to capture long strips of imagery. For consistency, the sensor usually acquires an image in a roughly north-south orientation. This means that Maxar acquisitions can vary in shape and size. Below shows an acquisition that is about 16 kilometers wide by 52 kilometers long.
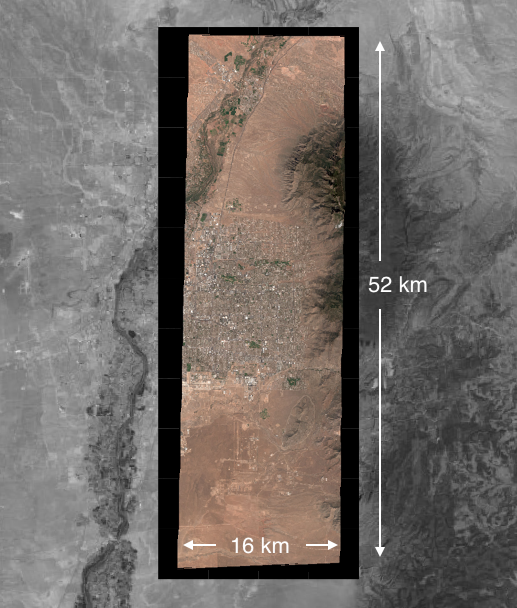
The large physical size of the image also means there's a lot of data to work with. This strip of imagery has approximately 12 billion pixels, and could have 8 bands of spectral data which means almost 100 billion data points.
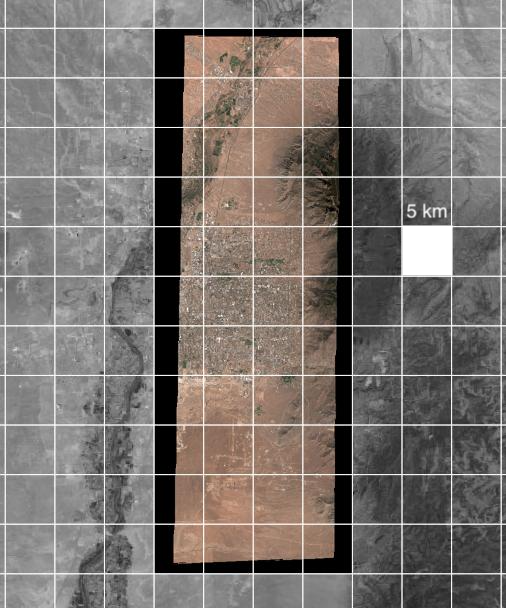
ARD divides acquisitions into 5 kilometer square tiles using a discrete UTM grid system. This offers several advantages for analysis:
- Our search tools also look at the tile level, so metadata like cloud coverage is more focused
- The grid system provides a framework to organize data spatially
- The resulting files sizes make for convenient units of work
Maxar has been using tiles and massively parallelized cloud processing for 10 years in its journey to create the world's only high-resolution continental-scale seamless mosaics. ARD now opens up opportunities for our customers to leverage this approach to image analysis and processing from a proven starting point.
ARD Tile Components
When ARD imagery is ordered, three cloud-optimized GeoTIFFs (COGs), a set of data masks, and the metadata for these images are delivered.
Raster Image Data
Three raster images are included in an ARD delivery:
- a multispectral image
- a panchromatic image
- a "visual" image
Multispectral and Panchromatic image preprocessing
The multispectral and panchromatic images are minimally preprocessed to optimize for machine learning algorithms. The preprocessing steps that produce the panchromatic and multispectral ARD tiles are:
- Atmospheric compensation
- Orthorectification to native resolution, as captured by the sensor
- Saved as Cloud Optimized GeoTIFF (COG) with overviews and internal tiling
Visual image preprocessing
The "visual" format is generated from the panchromatic and multispectral images, with these additional processing steps:
- Pansharpened
- Radiometrically balanced per tile
- Dynamic range adjusted to 8-bit image projection
- Resampled to 0.30517578125m pixel size and aligned to the ARD grid
- COG uses additional YCbCr JPEG compression for smaller file size
Note: Night time imagery cannot be ordered as Analysis-Ready Data. Night time imagery is any imagery with a sun elevation of less than 5.
Bundle Block Adjustment
Bundle Block Adjustment (BBA) is an internal process that leverages the positional information in deep blocks of cached images to provide smoother seamlines and improved alignment of vectors. It runs through Amazon Web Services (AWS) and offers unprecedented scalability for high resolution imagery. BBA is an optional step in the ARD ordering process and can be applied to any ARD stack depth.
Maxar HD
HD is a proprietary process owned by Maxar that improves the visual clarity of an image. HD technology can upsample an image and reconstruct details such as hard edges and finer features. If this option is enabled on an ARD order, images collected at a resolution above 40cm will be processed with HD to appear like they were collected closer to a 30cm pixel size. This allows, for example, a GeoEye-1 or Worldview-2 image collected at 50cm to visually appear more like a 30cm Worldview 3 native collect. HD 30cm processing is applied to the pansharpened RGB Visual ARD image tile only.
Maxar Grid Alignment
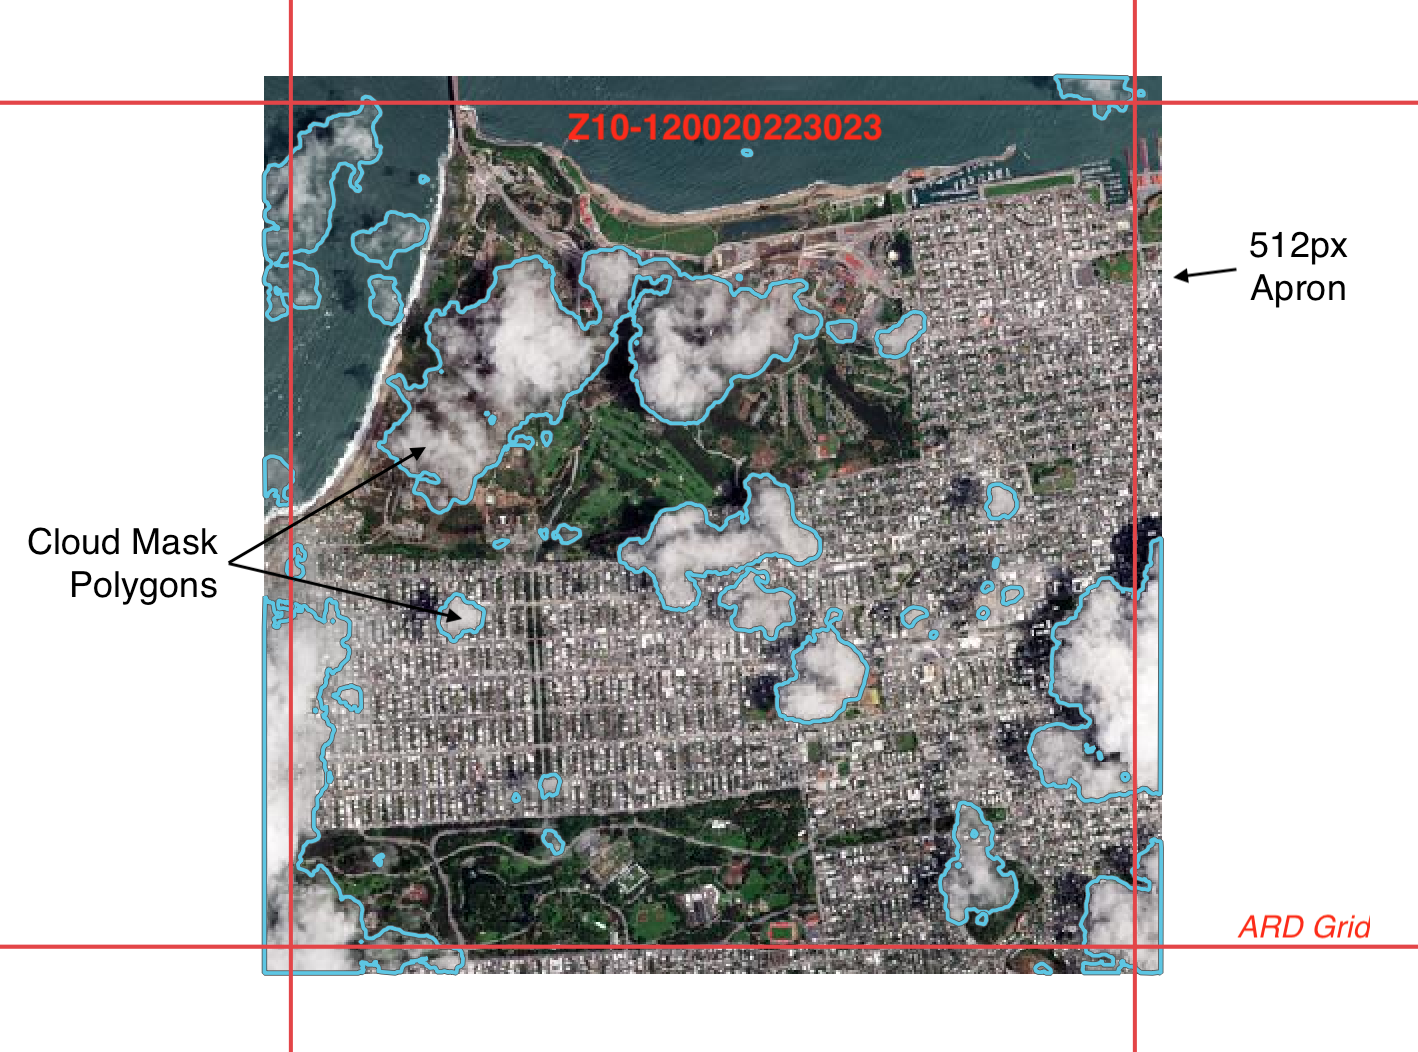
Tiles are clipped to the 5km Maxar grid, and include an apron of 512 pixels outside of the grid boundary. The apron gives you extra overlapping data so that analyses like object detection do not have to contend with seams between adjacent tiles.
Note: the apron data is provided as a courtesy and is not counted towards data usage.
The image below shows an ARD tile with cloud mask polygons overlaid. The data extends outside the grid cell boundary by 512 pixels.
To learn more, see “The Maxar Data Grid” below.
Masks
A set of data masks is included with the image tiles in an ARD order delivery in vector and raster format. These masks detect the following conditions within an AOI:
- Clouds
- Data/no data
- Healthy vegetation
- Multispectral pixel saturation
- Panchromatic flare
- Terrain shadows
- Water
Image Metadata
The final component of the ARD image files is a metadata file using the SpatioTemporal Asset Catalog (STAC) format. This file includes metadata about the raster and vector data portions of the tile. It also includes information about the source collection, such as sun elevation, off-nadir angle, and others.
ARD Image Sources
ARD datasets are currently produced from data collected by the following satellites from the Maxar constellation:
GeoEye-1: View or download the GeoEye-1 datasheet
WorldView-1: View or download the WorldView-1 datasheet
WorldView-2: View or download the WorldView-2 datasheet
WorldView-3 (VNIR): View or download the WorldView-3 datasheet
WorldView-4: View or download the WorldView-4 datasheet
Note: Because WorldView-1 imagery is single-band panchromatic imagery, a WorldView-1 ARD delivery includes a subset of ARD assets.
Maxar Digital Elevation Model (DEM)
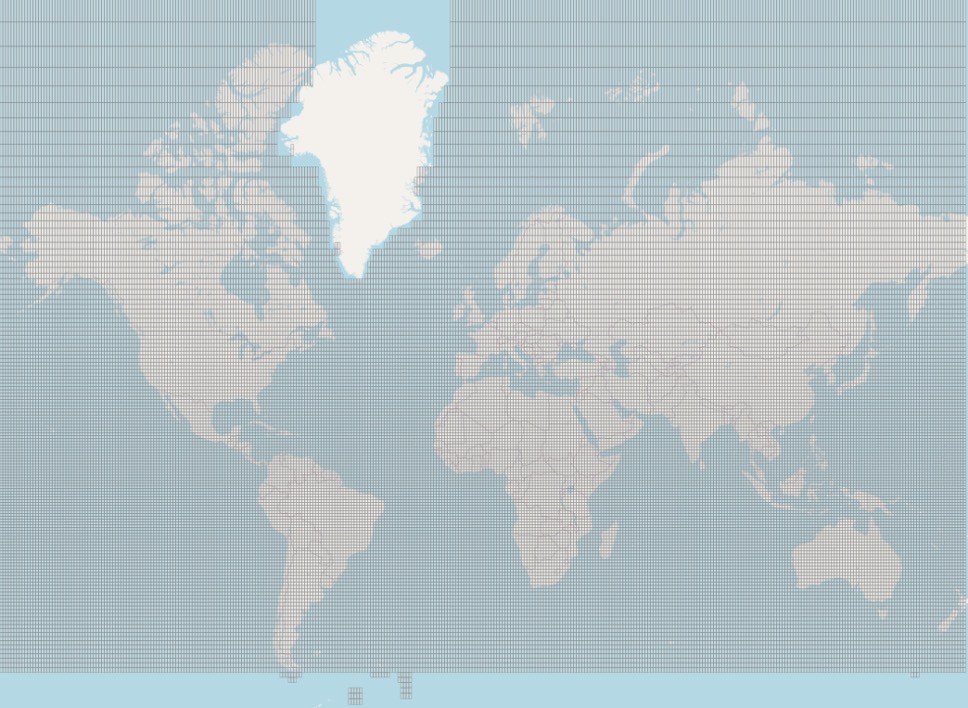
Maxar ARD is available for areas within the boundaries of Maxar's Digital Elevation Model (DEM). ARD is not available in the Arctic, Greenland, or Antarctica. There is 100% DEM coverage between 60N and 56S latitude.
This image shows the geographic extent of ARD availability. Areas without grid cells are unavailable.
The Maxar Data Grid
Imagery from ARD is organized on a globally discrete grid system. Locating images on a common grid system simplifies time-series analysis. It also serves as a structure to organize the files.
A recursive quadkey structure is used to define the grid structure. Simply put, quadkey structures involve dividing a square space in half in each direction to create four smaller squares. Each square is then in turn divided into four more squares. The process is repeated as needed.
As suggested by the name, quadkey division also gives each square a unique key. This identifier can be used to describe any of the squares, and gives a way to uniquely describe data that uses quadkey cells as boundaries.
The Maxar grid builds on the 10km cell structure from the Military Grid Reference System (MGRS). This means it also uses a discrete grid in each UTM zone. Using UTM as a basis for the grid system means pixels are nearly equal-area across the span of the zone. This makes it possible to use pixel counting to support area calculations.
Descending one quadkey level, we divide the 10km MGRS cells into four 5km grid cells. These cells are used to define the boundaries of the ARD image tiles. This is the fundamental unit of ARD products. In our system this is the 12th level, or "zoom" of the quadkey system.
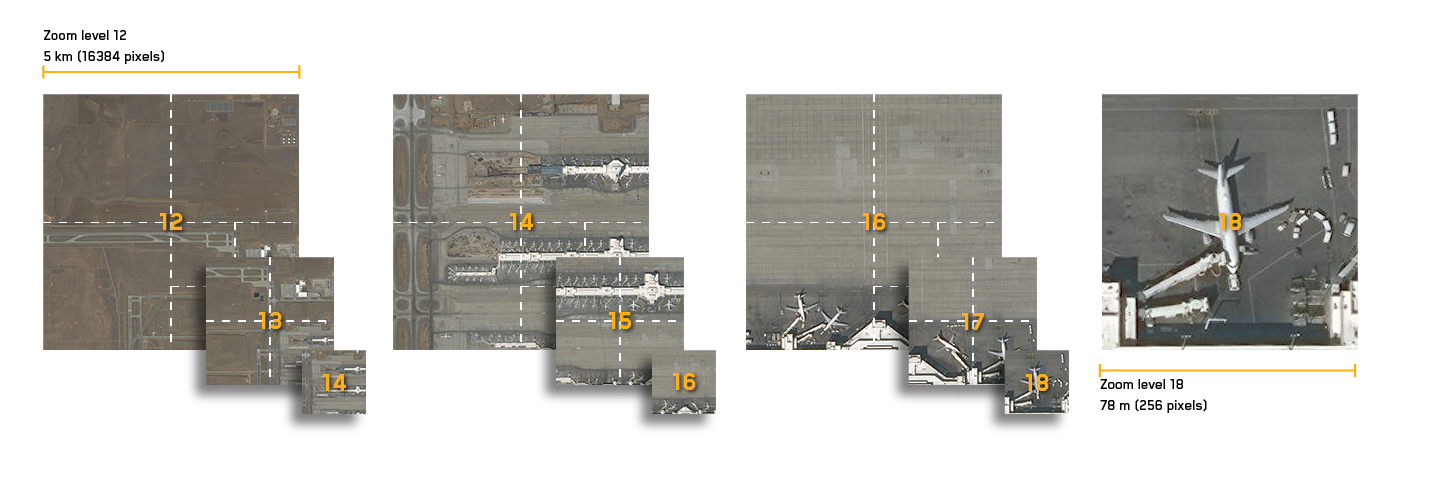
A 5km cell further subdivided 14 more times down to zoom level 26 results in a grid of only 0.30517578125m per side. Since this value is close to our 30cm target resolution, we can use this value as our base image resolution. This means that if you divide an ARD tile into smaller tiles or chips, you will get images with these qualities:
| Zoom Level | Size(m) | Pixels |
|---|---|---|
| 12 | 5000.0 | 16384 |
| 13 | 2500.0 | 8192 |
| 14 | 1250.0 | 4096 |
| 15 | 625.0 | 2048 |
| 16 | 312.5 | 1024 |
| 17 | 156.25 | 512 |
| 18 | 78.125 | 256 |
| 19 | 39.0625 | 128 |
This graphic shows an ARD image divided by cells at increasingly larger zoom levels. Zoom level 18, at 256 pixels, is a common size for image chips for training Machine Learning models.
To download Maxar grid vector files by UTM zone, see ARD Grid Vector Files.